
Wingo Trend Chart Explained: Missing Numbers, Frequency & Streaks
Learn how to read a Wingo trend chart, including missing numbers, average missing, frequency, streaks and max consecutive results, with real calculation examples and a simple guide for readers in India.
In this article
- Wingo Trend Chart Explained: Missing Numbers, Frequency & Streaks
- What Is a Wingo Trend Chart?
- Wingo Game History vs Trend Chart: What's the Difference?
- The Five Wingo Chart Terms You Should Know
- A Worked Wingo Chart Example Using 12 Rounds
- Frequency for Number 4
- Current Missing for Number 4
- Average Missing for Number 4
- Max Consecutive for Number 4
- Missing Numbers Explained: Does Missing Mean a Number Is Due?
- What Does Average Missing Mean on a Wingo Chart?
- Frequency Chart: Why a Popular Number Is Not Automatically More Likely
- Max Consecutive and Streaks: Two Different Ways to Read Repetition
- Why Trend Lines Can Look Predictive Even When They Aren't
- Number Trends vs Colour Trends vs Big/Small Trends
- How to Read a Wingo Trend Chart Step by Step
- How Many Rounds Should You Look At?
- Common Wingo Chart Reading Mistakes
- Can a Wingo Trend Chart Prove a Game Is Fair?
- Frequently Asked Questions About Wingo Trend Charts
- What is a Wingo trend chart?
- What does Missing mean in Wingo?
- Does a high Missing number mean the digit will appear next?
- What does Average Missing mean?
- What does Frequency mean in a Wingo chart?
- What is Max Consecutive in Wingo?
- Can a digit have high Frequency and low Max Consecutive?
- Why are two Wingo trend charts different?
- Is a Wingo trend chart the same as a live result page?
- Can Wingo trend charts accurately predict the next result?
- Final Thoughts
- Further Reading
Wingo Trend Chart Explained: Missing Numbers, Frequency & Streaks
A Wingo trend chart can look complicated at first. Alongside a list of results, you might see numbers labelled “Missing”, “Average Missing”, “Frequency” or “Max Consecutive”. Some charts also connect result digits with coloured dots, making past rounds look like a pattern.
What do those figures actually mean? And why might two charts show different statistics even when they are discussing the same game?
This guide explains the main Wingo trend chart terms in plain English, then works through a complete example using 12 fictional rounds. It is written for readers in India who want to understand WinGo-style result data rather than rely on guesses about future outcomes.
Quick answer: A Wingo trend chart summarises completed rounds. Frequency counts how often a digit appeared, Missing counts how many recent rounds passed without it, Average Missing describes the gaps between past appearances, and Max Consecutive describes the longest uninterrupted run within a selected set of results. These statistics explain history; none guarantees the next number.
What Is a Wingo Trend Chart?
A Wingo trend chart is a visual or numerical summary of previous results in a WinGo-style number game. A normal history list might show only a period ID, one result digit and the associated colour or Big/Small label. A trend chart adds a second layer: it organises those results so readers can see counts, gaps and repeated outcomes.
Depending on the particular website, you may encounter:
- A row of digits from 0 through 9.
- Dots showing the result digit for each completed period.
- Lines joining dots across consecutive periods.
- A Missing row for each digit.
- Average Missing and Frequency statistics.
- Max Consecutive figures or a separate streak display.
- Big/Small or colour summaries based on the same completed results.
Not every Wingo game interface includes all of these elements. Third-party chart pages can also define or calculate them differently. Read the labels and sample size before treating any figure as meaningful.
Wingo Game History vs Trend Chart: What's the Difference?
Game history is the underlying record: one completed round, its identifying period number and its displayed result. A trend chart is a different presentation or calculation built from those rows.
Imagine that game history shows three fictional completed results in order: 7, 2, 7. The trend chart may highlight the two appearances of 7, show that 2 appeared once, and draw lines between the plotted positions.
The lines do not introduce new outcomes. They connect historical observations. A complicated-looking visual may still be based on only a handful of results.
Before reading any chart, check whether it covers the latest 10, 20, 50 or 100 completed periods. Comparing a 10-round frequency statistic with a 100-round statistic without noticing the difference will create misleading conclusions.
The Five Wingo Chart Terms You Should Know
Result number: The digit recorded for a completed round, commonly in the range 0–9.
Frequency: How many times a particular digit appears within the chart's selected history window.
Missing: How many completed rounds have passed since that digit most recently appeared. A digit appearing in the latest row generally has a current missing count of zero.
Average Missing: An average of historical gaps between appearances, according to the chart's calculation method. Some interfaces calculate gaps as absent rounds; others may use different period-based conventions.
Max Consecutive: The longest run of uninterrupted appearances of the same result or category in the selected history window. The chart should make clear whether it measures an individual digit, a colour or Big/Small.
Knowing the definitions makes the display easier to understand, but you still need to know how the numbers were calculated.
A Worked Wingo Chart Example Using 12 Rounds
Let's use one fictional dataset from oldest to newest:
4, 1, 7, 4, 2, 4, 9, 4, 3, 4, 6, 8
These are teaching examples, not historical results from a live platform.
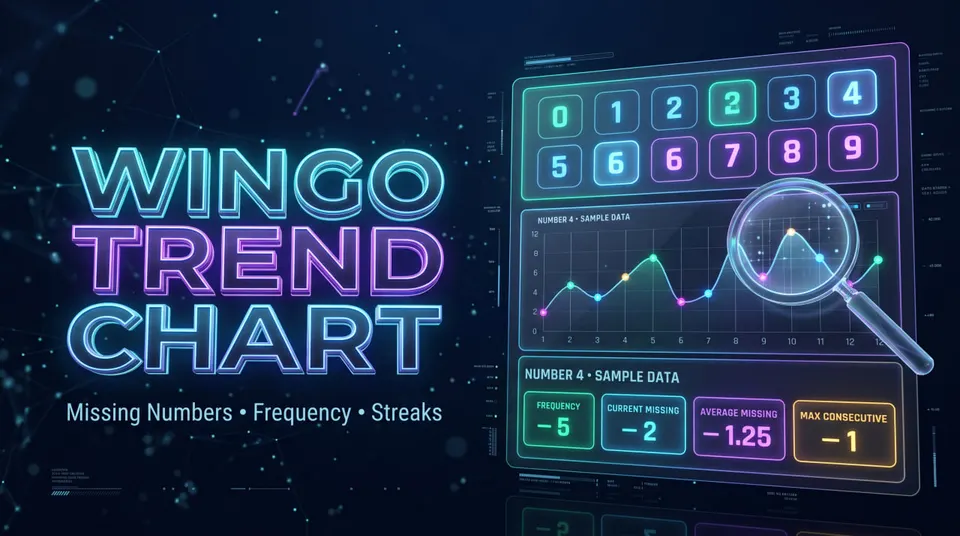
There are 12 completed rounds. Digit 4 appears in positions 1, 4, 6, 8 and 10. Digit 7 appears once, at position 3. The last two results are 6 and 8.
All the calculations below use exactly this 12-round sample. That consistency matters: changing the underlying window changes the statistics.
Frequency for Number 4
Number 4 appears five times, so its frequency is 5.
If you want its percentage of this sample:
Frequency percentage = 5 ÷ 12 × 100 = approximately 41.7%.
That tells you that 4 accounts for about 41.7% of this tiny example. It does not establish that 4 has a 41.7% chance of appearing in the next round.
Current Missing for Number 4
The most recent 4 is at position 10. Positions 11 and 12 are 6 and 8, so two completed rounds have passed without another 4.
The current Missing count for digit 4 is therefore 2.
If the newest result had been a 4, its current Missing count would usually be 0. This is why it is important to know which side of the chart displays the newest period.
Average Missing for Number 4
The 4s occur at positions 1, 4, 6, 8 and 10. Count how many rounds lie between consecutive 4s:
- Between positions 1 and 4: 2 missing rounds.
- Between positions 4 and 6: 1 missing round.
- Between positions 6 and 8: 1 missing round.
- Between positions 8 and 10: 1 missing round.
That gives four observed gaps: 2, 1, 1 and 1.
Average Missing = (2 + 1 + 1 + 1) ÷ 4 = 1.25 rounds.
Under this specific definition, 1.25 is the historical average number of absent rounds between successive appearances of 4. Another interface might measure the average distance between appearances and return a different figure. Check the platform's definition rather than assuming all charts agree.
Max Consecutive for Number 4
Number 4 never appears in two adjacent positions in this example. Its longest uninterrupted run is only one result.
Therefore, Max Consecutive for digit 4 = 1.
Notice how a digit can have a high frequency but a low consecutive value. Five appearances spread across a dataset are not the same as five appearances in a row.
Missing Numbers Explained: Does Missing Mean a Number Is Due?
No. The Missing statistic describes the time since a digit last appeared in the selected record. It does not create a deadline for that digit to return.
Suppose a number has been absent for 12 completed rounds. A chart may display Missing = 12. That is a fact about the recorded history, assuming the records are accurate. It does not mean the next result must be that number.
In a hypothetical system where all ten digits are equally likely and rounds are independent, the probability of any specific digit is 1 in 10 for each new round. Its previous absence does not change that probability. That is a mathematical example, not a claim that an unverified Wingo operator necessarily uses such a system.
This distinction matters because terms such as “overdue”, “hot” and “cold” can sound like forecasts, even though they often describe only what happened previously.
What Does Average Missing Mean on a Wingo Chart?
Average Missing can be useful for describing the spacing of past appearances. It helps answer a historical question: within this selected sample, how much time usually passed between sightings of a digit?
But the term has two common traps.
First, different definitions produce different numbers. Some interfaces count the rounds that did not contain the digit, while others count the interval between the two appearance positions. These differ by one for each completed gap.
Second, the sample may be incomplete. If a chart starts halfway through a long absence, it may not know when the previous occurrence happened. Some charts exclude incomplete gaps; others include them. That can change the displayed average.
When the source does not explain its formula, treat Average Missing as a platform-specific historical indicator rather than a universal statistic.
Frequency Chart: Why a Popular Number Is Not Automatically More Likely
Frequency is simply a count. If number 4 appeared 5 times in our 12-round sample, its frequency is five. If number 7 appeared once, its frequency is one.
Those statements are useful descriptions of the sample. They do not, by themselves, tell you whether the next result will be 4 or 7.
A small dataset naturally contains uneven counts. A large dataset might also contain imbalances. To evaluate whether a real game behaves as advertised, a reader would need reliable records and independently verified information about the outcome mechanism—not just a coloured chart.
Also distinguish raw frequency from frequency percentage. A number with 20 appearances in a 100-round chart has a 20% observed frequency; a number with 4 appearances in a 10-round chart has a 40% observed frequency. Raw counts from those windows cannot be compared directly.
Max Consecutive and Streaks: Two Different Ways to Read Repetition
Max Consecutive usually identifies the longest run in which the same defined outcome kept appearing without interruption.
For an individual digit, a sequence of 2, 2, 2 would have a three-round run of digit 2. A sequence of 2, 5, 2, 2 would have a maximum consecutive run of only two for digit 2.
For categories, the answer can differ. A Big/Small chart may call 5, 7, 9 a three-round Big streak even though no exact digit repeated.
In our fictional 12-round sample, the Big/Small labels are:
Small, Small, Big, Small, Small, Small, Big, Small, Small, Small, Big, Big.
The longest Small streak is 3, and the longest Big streak is 2. That is different from the individual-digit Max Consecutive for number 4, which is 1.
Always check what the chart is counting before comparing one streak value with another.
Why Trend Lines Can Look Predictive Even When They Aren't
Some Wingo charts join result points with a zigzag line. As soon as points are connected, the viewer may see apparent upward movement, downward movement or repeated shapes.
However, the digits 0–9 are discrete game labels, not a continuously moving market price. A line moving from 2 to 8 does not represent the same sort of change as a share price moving between two values.
A chart may be useful for visualising where recorded numbers occurred. But it cannot turn an old sequence into a verified forecast merely by drawing connecting lines or adding colourful indicators.
The same caution applies to “trend strength”, “confidence” or “prediction accuracy” labels. Unless a site clearly explains what data and methods were used, these labels may be difficult to evaluate.
Number Trends vs Colour Trends vs Big/Small Trends
These are three related summaries, but they are not identical.
Number trend: Tracks the exact digits 0–9. A sequence like 4, 1, 7 tells you which numbers occurred.
Colour trend: Groups completed digits by the colour mapping of a particular game version. Special results such as 0 and 5 may have mixed-colour labels, so a colour-only chart may be harder to interpret without the published mapping.
Big/Small trend: Groups common 0–9 results as Small for 0–4 and Big for 5–9. This describes the size category rather than the exact digit.
One completed result can contribute to all three summaries at once. For example, 8 may be counted as a number 8 appearance, a Red result and a Big result under a common WinGo-style mapping.
Read Wingo Big Small Explained for the size classification, or the Wingo Colour and Number Chart Guide for the more detailed digit mapping.
How to Read a Wingo Trend Chart Step by Step
A chart becomes much easier to interpret if you follow the same order every time.
Step 1: Identify the game mode. Check whether the statistics are attached to a one-minute, three-minute or another round duration. Do not mix unrelated histories.
Step 2: Identify the newest completed period. Find the last settled result and verify whether the chart displays newest-first or oldest-first.
Step 3: Check the sample size. Determine whether the chart covers 10, 20, 50 or 100 rounds. The same digit may have different statistics in each window.
Step 4: Read Frequency as a count. Ask how many times the selected number occurred within that sample.
Step 5: Read Missing as an elapsed count. Ask how many completed rounds have passed since the number's most recent occurrence.
Step 6: Check how Average Missing is defined. Do not assume it is a countdown to the next appearance.
Step 7: Identify what Max Consecutive measures. Is it tracking an exact digit, colour or Big/Small category?
Step 8: Keep results and predictions separate. A visual pattern on a historical chart does not establish what will happen in the next period.
These steps work for educational analysis without requiring a reader to participate in a money game or install a third-party prediction app.
How Many Rounds Should You Look At?
There is no universal number of rounds that turns a history chart into an accurate prediction tool. A 10-round window shows a small, recent sample; a 100-round window shows more records and may make short-term fluctuations less prominent.
Neither guarantees any future result.
Small windows are especially sensitive to individual outcomes. If digit 4 appears one additional time in a 10-round window, its observed frequency percentage changes by 10 percentage points. One additional appearance in a 100-round window changes the share by 1 percentage point, assuming the comparison window is otherwise fixed.
This is one reason charts can look dramatically different depending on how many periods they include. The window size changes the description, not the underlying result that has already been recorded.
Common Wingo Chart Reading Mistakes
Mistake 1: Thinking Missing is a countdown. Missing measures previous absence, not rounds remaining until an appearance.
Mistake 2: Confusing Frequency with probability. Observed historical frequency is not automatically the next-round chance.
Mistake 3: Mixing different sample sizes. A 10-round count and a 100-round count describe different windows.
Mistake 4: Reading the chart backward. Some pages place the newest period at the top, while others show it at the bottom or right.
Mistake 5: Mixing exact-number streaks with colour streaks. Several Green results can occur without the same digit repeating.
Mistake 6: Assuming every site defines Average Missing identically. Some count absent rounds, others count intervals.
Mistake 7: Treating a decorative line as a prediction. Connected historical dots do not produce a forecast by themselves.
Mistake 8: Using an incomplete history as complete data. Loading delays or missing periods can distort counts and gaps.
Can a Wingo Trend Chart Prove a Game Is Fair?
A trend chart alone cannot prove that a particular game is fair or unfair. It usually shows only outcomes reported by the website or third-party source that produced the chart.
To make a stronger claim about fairness, you would need evidence about the underlying result-generation method, complete and trustworthy records, and appropriate independent testing. A few unusual-looking streaks are not sufficient evidence either way.
Likewise, a chart that looks approximately balanced does not by itself establish that the underlying process was independently random or audited.
For readers in India comparing online WinGo statistics pages, the useful question is not whether a chart looks impressive. It is whether the source identifies the period, explains its calculations and clearly separates recorded facts from guesses.
Frequently Asked Questions About Wingo Trend Charts
What is a Wingo trend chart?
It is a statistical or visual summary of previous WinGo-style results. Some versions show number frequency, missing counts, average gaps and consecutive streaks.
What does Missing mean in Wingo?
Missing typically counts the completed rounds since a digit last appeared. If it appeared in the latest round, the current missing value is usually zero.
Does a high Missing number mean the digit will appear next?
No. A high Missing value describes a past absence. It does not guarantee the next result, especially in a system where outcomes are independent.
What does Average Missing mean?
It summarises historical gaps between appearances. The exact formula can vary between chart providers, so review the page's definition if available.
What does Frequency mean in a Wingo chart?
Frequency is the number of times a digit appeared within the chosen sample of completed rounds.
What is Max Consecutive in Wingo?
It means the longest uninterrupted run for a specific digit or category in the selected sample. The measured category must be identified.
Can a digit have high Frequency and low Max Consecutive?
Yes. A number can appear many times spread across a chart without ever appearing in back-to-back rounds.
Why are two Wingo trend charts different?
They may use different game modes, sample sizes, time windows, data feeds, calculation rules or refresh times.
Is a Wingo trend chart the same as a live result page?
Not necessarily. A live result page aims to display updated outcomes; a trend chart organises and calculates statistics from completed results. Some interfaces contain both.
Can Wingo trend charts accurately predict the next result?
Past statistics alone do not establish a guaranteed or dependable next-number forecast. A claim of predictive accuracy requires independently verifiable testing, not just selected screenshots.
Final Thoughts
The most useful way to read a Wingo trend chart is to treat it as a record of previous rounds. Frequency counts appearances; Missing counts recent absences; Average Missing describes past gaps; and Max Consecutive captures the longest run in a chosen sample.
Our 12-round example shows why these values should be read together. Number 4 appeared five times, had a current missing count of two and an average gap of 1.25 absent rounds between appearances, yet never repeated in adjacent rounds.
That is useful statistical information. It is not a formula for the next result.
If you can identify the selected mode, sample size, completed periods and calculation definitions, you can understand most Wingo statistics screens without confusing visual trends with reliable forecasts.