Wingo Big Small Patterns: Same Numbers, Different Streaks
Can two Wingo Big Small charts contain exactly the same numbers but show opposite patterns? Explore a 20-round experiment explaining Big Small streaks, alternation, switch rates and 50/50 result history.
In this article
- Wingo Big Small Patterns: Same Numbers, Different Streaks
- Quick Answer: Can Two Wingo Big Small Charts Have the Same Numbers but Different Patterns?
- First, Understand the Wingo Big Small Number Rule
- What Does a 50/50 Big Small Result History Actually Mean?
- Our Original Experiment: Two Histories, the Same 20 Numbers
- Example A: Alternating Big and Small
- Example B: Big Results Followed by Small Results
- Both Examples Have Identical Number Frequencies
- Example A: Calculating a 100% Big Small Switch Rate
- Example B: Calculating a 5.26% Switch Rate
- Switch Rate vs Repeat Rate: What Is the Difference?
- Wingo Big Small Streaks: Why the Longest Run Changes
- Longest Streak in Example A
- Longest Streak in Example B
- What Does a Run Mean on a Wingo Trend Chart?
- Three Numbers Every Big Small Chart Reader Should Separate
- 1. Category Frequency
- 2. Switch Rate
- 3. Longest Streak
- Why a 50/50 Chart Does Not Mean Results Should Alternate
- Does a Long Big Small Streak Mean the Next Result Must Change?
- How to Calculate Big Small Switches Yourself
- Does a Big Small Pattern Change If You Reverse the History?
- Can Two Charts Have the Same Colour Totals Too?
- What Changes When the History Window Changes?
- How to Read Wingo Big Small History Without Mixing Rounds
- Common Mistakes When Analysing Big Small Patterns
- What Makes This Big Small Comparison Different?
- Wingo Big Small Patterns: Frequently Asked Questions
- Can Wingo Big Small show exactly 50% Big and 50% Small?
- Does 50/50 mean Big and Small alternate every round?
- What is a Wingo Big Small streak?
- What is a Big Small switch?
- How do you calculate a Wingo Big Small switch rate?
- Why are there only 19 transitions in 20 rounds?
- Can two Wingo charts have identical numbers but different streaks?
- Is a Big Small streak the same as repeating an exact number?
- Does a 100% historical switch rate guarantee the next round will switch?
- Does a long Small streak mean Big must appear next?
- Are Wingo Big Small patterns the same across one-minute and three-minute modes?
- What should I check before comparing two Wingo result charts?
- Final Thoughts
- Related Wikipura Guides
- Further Reading
Wingo Big Small Patterns: Same Numbers, Different Streaks
Two Wingo Big Small charts can show exactly 50% Big and 50% Small but look completely different. One may alternate between Big and Small almost every round. Another may show a long series of Big results followed by a long series of Small results.
Here is the surprising part: both charts can contain exactly the same result numbers.
That means a Wingo Big Small percentage chart does not tell the whole story. The order of results matters when you are describing past streaks, repeated categories and switches between Big and Small.
In this guide, we will examine two fictional 20-round histories containing the same ten digits, with each digit appearing exactly twice. We will calculate the Big/Small balance, streak lengths, switch rates and consecutive results to understand how different patterns can emerge from identical number frequencies.
These examples are educational calculations, not actual Wingo results or predictions.
Quick Answer: Can Two Wingo Big Small Charts Have the Same Numbers but Different Patterns?
Yes. Two result histories can contain exactly the same numbers with the same frequencies while displaying completely different Big Small patterns.
Imagine two sets of 20 completed rounds. Both contain ten Big results and ten Small results. Every digit from 0 to 9 appears twice in each set.
The difference is the order.
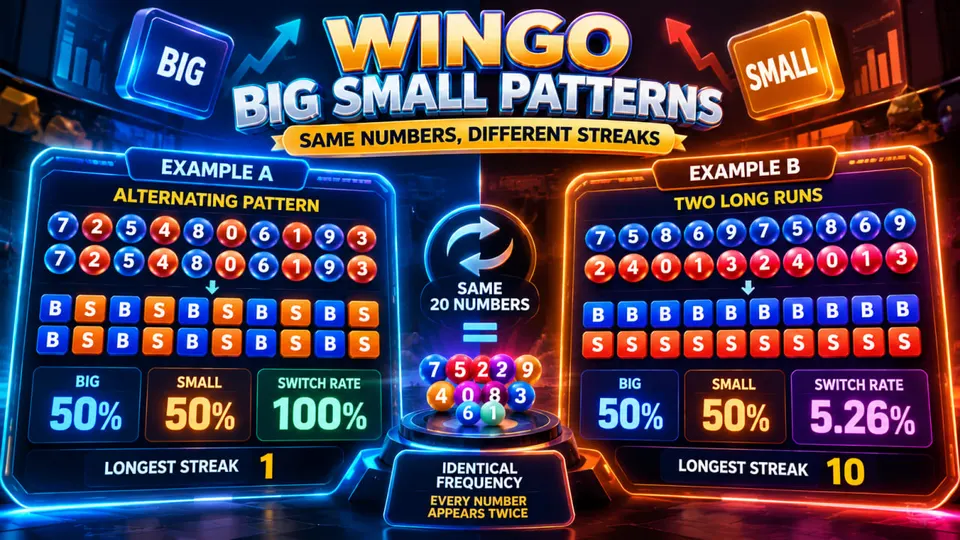
- Example A: Big and Small alternate every round, producing 19 category switches.
- Example B: Ten Big results appear first, followed by ten Small results, producing just one category switch.
Both have a 50/50 Big Small balance. Yet the first has a 100% historical switch rate, while the second has a switch rate of approximately 5.26%.
That is why frequency and sequence should be treated as separate characteristics of a Wingo result chart.
First, Understand the Wingo Big Small Number Rule
Before comparing patterns, we need a consistent way to classify each result.
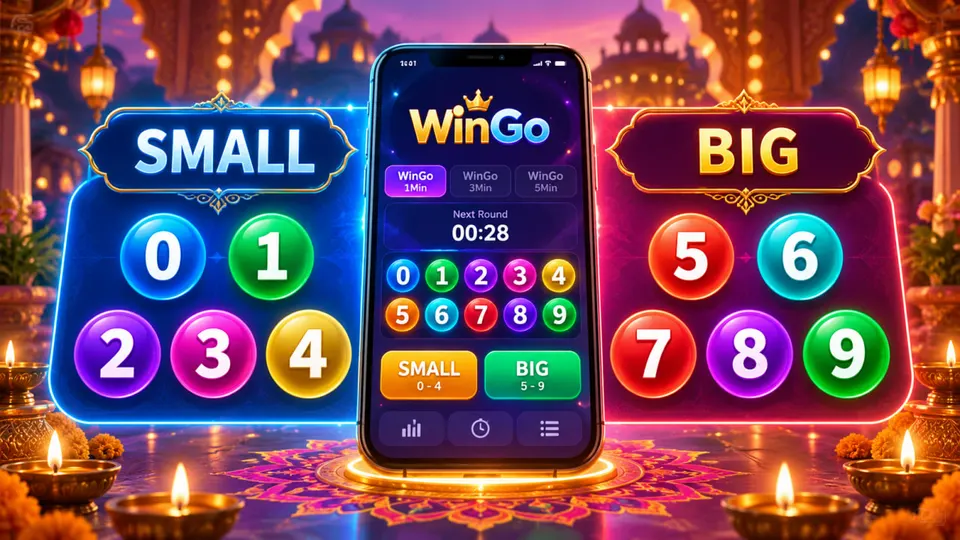
In a commonly described WinGo-style format, a completed round produces a result digit from 0 to 9.
The numbers are divided into two groups:
Small numbers
0, 1, 2, 3 and 4
Big numbers
5, 6, 7, 8 and 9
For example:
- Result 0 is Small.
- Result 2 is Small.
- Result 4 is Small.
- Result 5 is Big.
- Result 7 is Big.
- Result 9 is Big.
The boundary is between 4 and 5.
This classification is based on the final result digit. It does not depend on the colour label associated with that number.
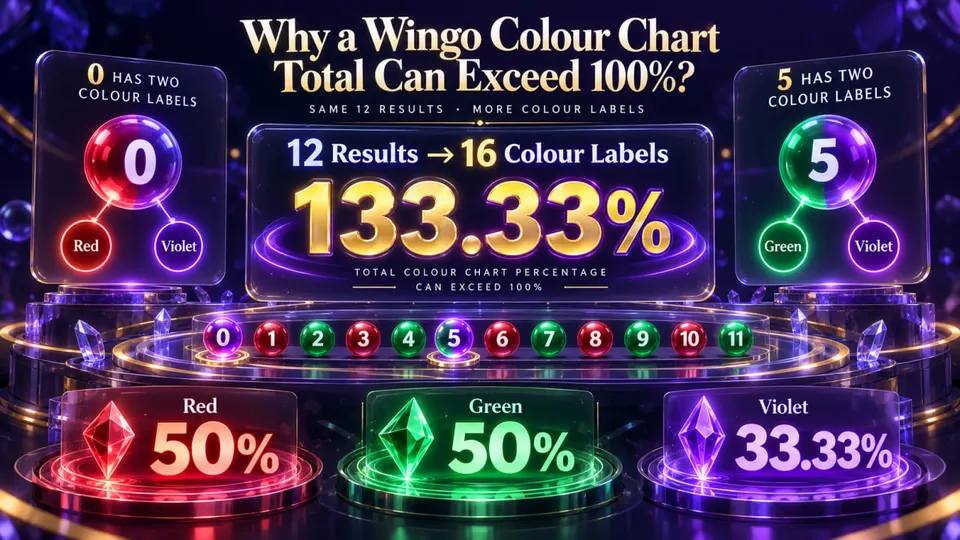
In some colour charts, 0 and 5 have special Violet-related labels. However, that does not change their Big Small classification in the common 0–4 and 5–9 format.
If you need a basic explanation of these categories before continuing, read Wingo Big Small Explained.
What Does a 50/50 Big Small Result History Actually Mean?
Suppose a Wingo history displays 20 completed results.
If ten results are Big and ten are Small, the historical distribution is:
Big percentage = 10 ÷ 20 × 100 = 50%
Small percentage = 10 ÷ 20 × 100 = 50%
This tells us how often each category appeared within the selected sample.
It does not tell us which category appeared first, how often Big and Small changed places, or whether the results were clustered into long streaks.
Consider a simple example.
A sequence of Big, Small, Big, Small has two Big and two Small results.
A sequence of Big, Big, Small, Small also has two Big and two Small results.
Both are 50/50, but their order is different.
The first changes category three times. The second changes category only once.
A percentage chart alone cannot show that difference unless it includes additional information about order.
Our Original Experiment: Two Histories, the Same 20 Numbers
To make this comparison fair, we will use the exact same collection of digits in both examples.
Every number from 0 through 9 appears exactly twice.
That gives us 20 completed results in each example.
Only the order changes.
Example A: Alternating Big and Small
Read this fictional sequence from the oldest round to the newest:
7, 2, 5, 4, 8, 0, 6, 1, 9, 3, 7, 2, 5, 4, 8, 0, 6, 1, 9, 3
Now convert every number into its Big or Small label.
- 7 = Big
- 2 = Small
- 5 = Big
- 4 = Small
- 8 = Big
- 0 = Small
- 6 = Big
- 1 = Small
- 9 = Big
- 3 = Small
The second half repeats the same ten-number order.
As a result, the complete Big Small sequence is:
B S B S B S B S B S B S B S B S B S B S
Every completed result belongs to the opposite category from the one immediately before it.
The pattern looks perfectly alternating.
Example B: Big Results Followed by Small Results
Now arrange the same 20 numbers differently:
7, 5, 8, 6, 9, 7, 5, 8, 6, 9, 2, 4, 0, 1, 3, 2, 4, 0, 1, 3
Nothing has been added or removed.
Every digit still appears exactly twice.
But the Big Small sequence has changed completely:
B B B B B B B B B B S S S S S S S S S S
The first ten results are Big.
The next ten results are Small.
Although Example B uses exactly the same numbers as Example A, it has a completely different sequence of categories.
Both Examples Have Identical Number Frequencies
Let's verify the most important detail.
In Example A:
- Number 0 appears twice.
- Number 1 appears twice.
- Number 2 appears twice.
- Number 3 appears twice.
- Number 4 appears twice.
- Number 5 appears twice.
- Number 6 appears twice.
- Number 7 appears twice.
- Number 8 appears twice.
- Number 9 appears twice.
The same is true for Example B.
Each exact digit represents 2 out of 20 results, giving it an observed frequency of 10%.
That means both histories have:
- The same 20 result digits.
- The same frequency for every digit.
- The same ten Big results.
- The same ten Small results.
- The same overall Big Small percentages.
Even the colour-label totals would be identical if both histories were interpreted using the same colour-mapping rules.
The only difference is the sequence.
This is an important lesson for anyone reading a Wingo Big Small trend chart: knowing which numbers appeared is not the same as knowing the order in which they appeared.
Example A: Calculating a 100% Big Small Switch Rate
Now let's examine the first history in more detail.
Example A alternates between Big and Small for all 20 rounds.
To calculate the historical switch rate, compare every result with the next result.
With 20 completed rounds, there are 19 pairs of neighbouring results.
Why 19 instead of 20?
Because the first result has no earlier result inside this selected sample to compare against.
The comparisons are:
- Round 1 to Round 2
- Round 2 to Round 3
- Round 3 to Round 4
- And so on, until Round 19 to Round 20
That produces 19 transitions.
In Example A, the category changes during every transition.
Therefore:
Number of switches = 19
Total transitions = 19
Switch rate = 19 ÷ 19 × 100 = 100%
This means every neighbouring pair in this historical example contains different Big Small categories.
It does not mean that the next round is guaranteed to switch.
Example B: Calculating a 5.26% Switch Rate
Next, examine the second sequence.
The first ten rounds are Big.
The following ten rounds are Small.
There are still 19 transitions because there are still 20 results.
However, the category changes only once: between Round 10 and Round 11.
Every transition within the first ten results is Big to Big.
Every transition within the last ten results is Small to Small.
The calculation becomes:
Number of switches = 1
Total transitions = 19
Switch rate = 1 ÷ 19 × 100 = approximately 5.26%
So the results look extremely different.
Example A switches 100% of the time in the selected sample.
Example B switches only 5.26% of the time.
Yet both contain the exact same numbers with the exact same frequencies.
That is the main finding of this demonstration.
Switch Rate vs Repeat Rate: What Is the Difference?
A switch occurs when two neighbouring results have different Big Small categories.
Examples:
Big → Small
Small → Big
A repeat occurs when two neighbouring results have the same category.
Examples:
Big → Big
Small → Small
For a completed sequence, every neighbouring pair either switches or repeats.
Therefore:
Switches + Repeats = Total Transitions
And:
Switch Rate + Repeat Rate = 100%
For Example A:
- 19 switches
- 0 repeats
- Switch rate: 100%
- Repeat rate: 0%
For Example B:
- 1 switch
- 18 repeats
- Switch rate: 5.26%
- Repeat rate: 94.74%
These values describe the selected 20-round sample.
They are not established probabilities for the next result.
A historical switch rate is a descriptive measurement. It does not become a prediction simply because it is expressed as a percentage.
Wingo Big Small Streaks: Why the Longest Run Changes
A streak is a sequence of consecutive results belonging to the same category.
For example:
Big, Big, Big
This is a Big streak of length three.
Small, Small
This is a Small streak of length two.
Now compare the two examples.
Longest Streak in Example A
Because Example A alternates every round, no two neighbouring results belong to the same category.
Every Big result forms a one-round run.
Every Small result also forms a one-round run.
Therefore:
Longest Big streak = 1
Longest Small streak = 1
Total runs = 20
Longest Streak in Example B
Example B begins with ten Big results followed by ten Small results.
Therefore:
Longest Big streak = 10
Longest Small streak = 10
Total runs = 2
This is the opposite extreme from Example A.
One history has twenty short runs.
The other has two long runs.
Yet both show the same overall number balance.
What Does a Run Mean on a Wingo Trend Chart?
A run is a consecutive block of the same category.
In the sequence:
Big, Big, Small, Small, Small, Big
There are three runs:
- Big × 2
- Small × 3
- Big × 1
The number of runs is three, while the longest run has a length of three.
Some Wingo-style chart websites show current streaks or longest streaks, but the definitions and display windows can vary.
A current streak normally refers to consecutive results ending at the latest completed round.
A longest streak refers to the largest uninterrupted block found anywhere inside the selected history window.
In Example B, the longest streak length is ten, but the current streak at Round 20 is Small × 10.
In Example A, the current streak at Round 20 is Small × 1.
This difference illustrates why the order of results matters.
Three Numbers Every Big Small Chart Reader Should Separate
There are three related statistics that readers often confuse.
1. Category Frequency
This counts how many completed results belong to Big or Small.
Both fictional examples have ten Big and ten Small results.
2. Switch Rate
This counts how often the category changes between neighbouring completed rounds.
Example A has a switch rate of 100%.
Example B has a switch rate of 5.26%.
3. Longest Streak
This measures the longest uninterrupted sequence belonging to one category.
Example A has a maximum category streak length of one.
Example B has a maximum category streak length of ten.
All three measurements are valid descriptions of history, but they answer different questions.
Frequency asks how many.
Switch rate asks how often the category changed.
Streak length asks how long the same category continued without interruption.
None of these measurements independently verifies the probability of a future outcome.
Why a 50/50 Chart Does Not Mean Results Should Alternate
It is tempting to assume that a perfectly balanced Big Small chart should alternate between its two categories.
But balance and alternation are different ideas.
A 50/50 balance refers to the number of appearances within a selected history window.
Alternation refers to the order in which those appearances occur.
A simple analogy is arranging ten blue cards and ten orange cards.
You can alternate the colours:
Blue, Orange, Blue, Orange...
Or place all ten blue cards first and all ten orange cards afterward.
The number of cards has not changed.
Only the order has changed.
The same principle applies to a Wingo Big Small result history.
Seeing 50% Big and 50% Small does not reveal whether the sample contains frequent switches, long runs or a combination of both.
Does a Long Big Small Streak Mean the Next Result Must Change?
No such conclusion follows from streak length alone.
Consider a hypothetical process that independently chooses Big or Small with equal probability for every round.
Under that specific mathematical model, the next category remains equally likely regardless of whether the previous results formed an alternating sequence or a long streak.
But that is a hypothetical model.
It does not establish that a particular Wingo platform has been independently verified to use an equal-probability or independent result-generation process.
The appropriate conclusion is narrower:
Historical streaks alone do not demonstrate a reliable method for knowing the next result.
A long Big streak is evidence that Big appeared repeatedly in the selected history.
A high switch rate is evidence that the two categories alternated frequently in that selected history.
Neither fact establishes what will happen in a new round.
How to Calculate Big Small Switches Yourself
You do not need a complex dashboard to calculate a switch rate.
Start with five fictional result numbers:
7, 2, 8, 9, 1
Convert them into categories:
- 7 = Big
- 2 = Small
- 8 = Big
- 9 = Big
- 1 = Small
The sequence becomes:
B S B B S
Now compare neighbouring results.
- B → S: Switch
- S → B: Switch
- B → B: Repeat
- B → S: Switch
There are five results and four transitions.
Three transitions are switches.
One is a repeat.
Switch rate = 3 ÷ 4 × 100 = 75%
Repeat rate = 1 ÷ 4 × 100 = 25%
The longest Big streak is two because there are two consecutive Big results in the middle.
This small example shows how to calculate historical patterns accurately without using a prediction tool.
Does a Big Small Pattern Change If You Reverse the History?
The way a Wingo chart arranges results matters.
Some interfaces show the newest period at the top.
Others display the oldest period first.
If a reader incorrectly assumes that the top of a newest-first history is the beginning of the sequence, the direction of changes can be misread.
Reversing a complete sequence does not change its total Big and Small counts, the total number of switches or the length of its longest streak.
However, it changes which end represents the latest result.
That affects the interpretation of the current streak and any description involving what followed a particular historical result.
For example, a history ending in Small × 10 has a current Small streak of ten. If a reader mistakenly reads it backward, that same block may appear to be at the beginning rather than the end.
Always identify the actual chronological order before calculating current runs or describing transitions.
Can Two Charts Have the Same Colour Totals Too?
Yes.
Our two examples use precisely the same numbers, so their colour-label totals will also be identical if the same colour rules are applied.
The only difference is when those results appeared.
That means three summaries can match between the two histories:
- Exact number frequencies.
- Big Small percentages.
- Colour-label totals.
And two important sequence statistics can still differ:
- Longest Big Small streak.
- Frequency of switches between categories.
This is why a chart showing only percentages or total frequencies can hide information about the historical order.
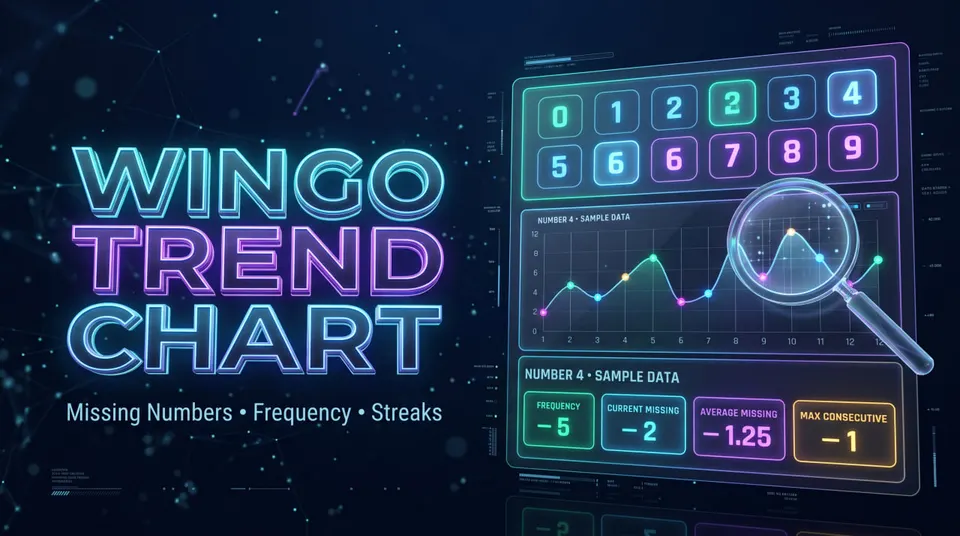
For further reading about statistical summaries, see Wingo Trend Chart: Missing Numbers, Frequency & Streaks.
What Changes When the History Window Changes?
Our worked example uses 20 completed rounds.
But a real chart may display only the latest 10, 20, 50 or 100 results.
When you change the window, you may also change the reported statistics.
For example, suppose you inspect only the first ten rounds of Example B.
They are all Big.
Within that shorter window:
- Big frequency = 10
- Small frequency = 0
- Longest Big streak = 10
- Switches = 0 across nine transitions
But when you examine the full 20 rounds, Big and Small are evenly balanced.
Both summaries correctly describe their selected windows.
They simply cover different portions of the history.
A chart percentage should always be read alongside the number of completed rounds included in its calculation.
Otherwise, two valid statistics may appear contradictory when they are describing different samples.
How to Read Wingo Big Small History Without Mixing Rounds
If you are reviewing a Wingo result-history screen, follow this sequence.
First: Identify the selected round duration, such as the one-minute or three-minute mode, if the interface provides those options.
Second: Identify the completed period IDs and the order in which they are displayed.
Third: Read the final result digit for each completed period.
Fourth: Convert each digit into Big or Small using the correct rules for that game version.
Fifth: Count Big and Small appearances within the selected sample.
Sixth: Compare neighbouring categories to identify switches and repeats.
Seventh: Count uninterrupted blocks to find streak lengths.
Do not mix incomplete rounds with completed results. Also avoid combining unrelated modes or histories from different websites.
An accurate historical comparison depends on using one consistent dataset.
Common Mistakes When Analysing Big Small Patterns
Mistake 1: Treating a 50/50 balance as an alternating pattern.
The same category totals can be arranged into very different sequences.
Mistake 2: Using the number of rounds as the number of transitions.
Twenty completed rounds have nineteen neighbouring transitions inside the sample.
Mistake 3: Confusing current streak with longest streak.
A current streak ends at the latest completed result. A longest streak may have occurred earlier.
Mistake 4: Counting exact-number repeats instead of Big Small repeats.
Results 7 and 8 are different digits, but both belong to Big.
Mistake 5: Mixing different history windows.
A ten-round chart and a twenty-round chart can give different summaries.
Mistake 6: Reading the chronology backward.
Newest-first and oldest-first interfaces require careful interpretation.
Mistake 7: Assuming a high switch rate predicts another switch.
A historical rate is not a guaranteed next-round probability.
Mistake 8: Assuming a long streak must continue or must end.
Neither conclusion follows from the streak alone.
What Makes This Big Small Comparison Different?
Most beginner explanations focus on which digits count as Big and which count as Small.
That is necessary, but it is only the first step.
This experiment examines a different question:
Can two result histories look completely different even though they contain the same numbers?
By using twenty identical digits in different orders, we have isolated the effect of sequence.
Nothing about the underlying number frequencies changes.
Only the arrangement changes.
The result is a useful demonstration of why percentage balance, switch rate and streak length should not be treated as interchangeable statistics.
The experiment can be repeated with any other set of fictional or verified historical numbers.
Its purpose is to improve the way readers understand result charts, not to forecast outcomes.
Wingo Big Small Patterns: Frequently Asked Questions
Can Wingo Big Small show exactly 50% Big and 50% Small?
Yes. If a selected history includes equal numbers of Big and Small results, the observed percentages are 50% each.
Does 50/50 mean Big and Small alternate every round?
No. An equal number of Big and Small results can appear in an alternating pattern or in longer uninterrupted streaks.
What is a Wingo Big Small streak?
A streak is a sequence of consecutive completed results belonging to the same Big or Small category.
What is a Big Small switch?
A switch occurs when a completed Big result is followed by Small, or a completed Small result is followed by Big.
How do you calculate a Wingo Big Small switch rate?
Count the number of category switches and divide it by the total number of neighbouring transitions. Multiply by 100 to obtain a percentage.
Why are there only 19 transitions in 20 rounds?
Because each transition connects two neighbouring results. A sequence of twenty results contains nineteen such connections.
Can two Wingo charts have identical numbers but different streaks?
Yes. Rearranging the same result digits changes their order, which can change streak lengths and switch counts without changing number frequencies.
Is a Big Small streak the same as repeating an exact number?
No. For example, 5, 7 and 9 are different numbers, but all belong to Big. Together they form a three-round Big streak.
Does a 100% historical switch rate guarantee the next round will switch?
No. It describes only the selected historical sample. It does not establish the probability or outcome of a future round.
Does a long Small streak mean Big must appear next?
No. A streak is a historical observation, not a countdown to the opposite category.
Are Wingo Big Small patterns the same across one-minute and three-minute modes?
Not necessarily. Different modes may have separate period histories. Their results should be analysed separately unless the underlying dataset is demonstrably the same.
What should I check before comparing two Wingo result charts?
Check the game mode, chronological order, number of completed rounds, period IDs and method used to calculate each statistic.
Final Thoughts
The same twenty Wingo result numbers can tell two very different stories when their order changes.
In our experiment, both fictional histories contained every digit from 0 through 9 exactly twice. Both produced ten Big and ten Small results, giving an identical 50/50 category balance.
But Example A switched between Big and Small nineteen times, while Example B switched only once.
The longest streak was one in Example A and ten in Example B.
The lesson is simple: frequency tells you how often something happened, while sequence tells you how it happened over time.
Understanding that distinction makes Wingo Big Small history easier to interpret and helps prevent confusion between recorded statistics and claims about future results.
For more foundational explanations, explore Wikipura's other guides on Big Small rules, result history and Wingo trend charts.
Related Wikipura Guides
- Wingo Big Small Explained
- Wingo Trend Chart: Missing Numbers, Frequency & Streaks
- Wingo Colour and Number Chart Guide
Further Reading
Editorial note: All 20-round sequences in this article were created for explanation. They are not live WinGo results, evidence of a specific game's outcome mechanism, or reliable predictions.